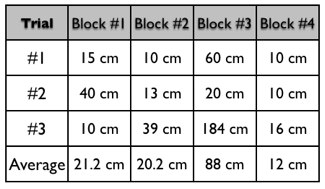
Data Table
Use a csddocs spreadsheet to create your table and graph.
Once they are created, take a screen shot (command shift 4 on a Mac computer)
Below are some examples.
Once they are created, take a screen shot (command shift 4 on a Mac computer)
Below are some examples.
Graph
Use the type of graph that will best represent your data. Bar graphs and lines graphs are both appropriate, but a pie graph might also work.

|

|
Interpretation of Data/Graph
Describe accurately in words what your graphs/charts show.
Conclusion
This should include answers to the following questions.
|
What were your results?
--put into words what your data says. --Was your hypothesis correct or not? |
Why did you get the results that you did?
--explain the science behind your results. |
Did you get the results your expected? Why or why not?
--your answer goes here |
What could have been done better on your project?
--your answer goes here |
Further Research
Based on your results, what else could be researched now? (Next year's experiment???)
